
 Aditi Kashikar, Automation Anywhere
June 1, 2022
Why be data-driven?
Data is a critical element to scaling your organization’s content strategy because data gives you access to insights and metrics that can objectively demonstrate the value your content brings to your customers. Without data and insights, it is difficult to gauge if your users are getting to the content they need, and finding it complete, relevant, and accurate to achieve their goals. Data is a useful tool to quantify success metrics for your internal content improvement initiatives and benchmark if they are producing the desired outcomes and overall ROI (return on investment).
 |
Data also helps content teams, and their leaders speak the language of their senior and executive leaders whose advocacy and support are critical to the success of their teams. |
How do you get started?
If you have an online and external-facing documentation portal or help center with no restrictions access to your product documentation, set up Google Analytics dashboards to report on traffic metrics, such as pageviews, user sessions, bounce rates, average time spent on a page, user sessions by language, country, and SEO metrics, such as impressions, clicks, click-through rate, and popular search queries to identify and address gaps in your user’s journey when they use a Google search to get to your public-facing content.
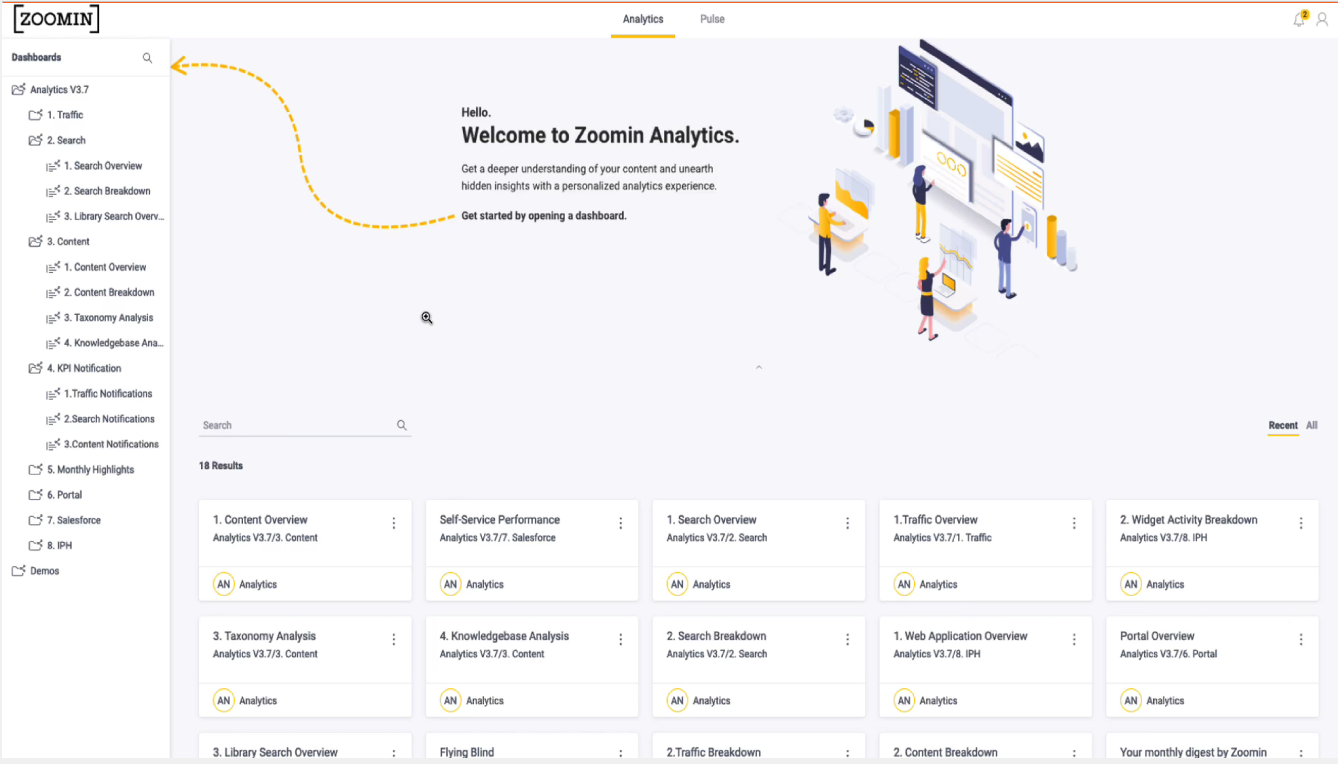
Implement an in-site analytics tool on your documentation portal or help center. At Automation Anywhere, we enabled Zoomin Analytics on our Zoomin documentation portal to give us a deeper look into our users’ search behavior and content consumption once they get to our documentation portal. Key metrics like search results with no clicks, search queries with no results, the average time users spend on a page, or new content that is created but is not being read can be especially useful to gain insights from.
For example, is your content missing relevant metadata in keywords? Is your content not using terminology that aligns with your users’ vocabulary?
Similarly, why is some of your new and updated content not being read? Is not being promoted by way of a Featured Content widget on your documentation portal, or is not surfacing up in relevant search results?
 Intuitive data visualization widgets in analytics tools have an added advantage of bringing content insights directly into the hands of content creators in your team and empowering them to be more strategic and user-centric in their approach. And who better than content creators to analyze and derive insights from this data.
Integrate internal project and defect management tools with your documentation feedback and bug reporting mechanisms. At Automation Anywhere, we integrated Atlassian Jira (our project and defect management tool) with the Feedback widget on our documentation portal so that documentation bugs reported by customers auto-created tickets in Jira that were tracked through to resolution. Jira’s powerful filters and reporting capabilities can be leveraged to track and deduce trends in documentation bugs reported over time.
Configure the customer case management system used by your Customer Support organization to implement a case resolution category to exclusively track and account for customer cases resolved through documentation. This provides another useful way to generate data on a reduction in customer cases, higher first-contact resolution, and lower mean time to resolve (MTTR) key performance indicators (KPIs) that benefit your Customer Support organization as well.
What’s next in our data-driven journey?
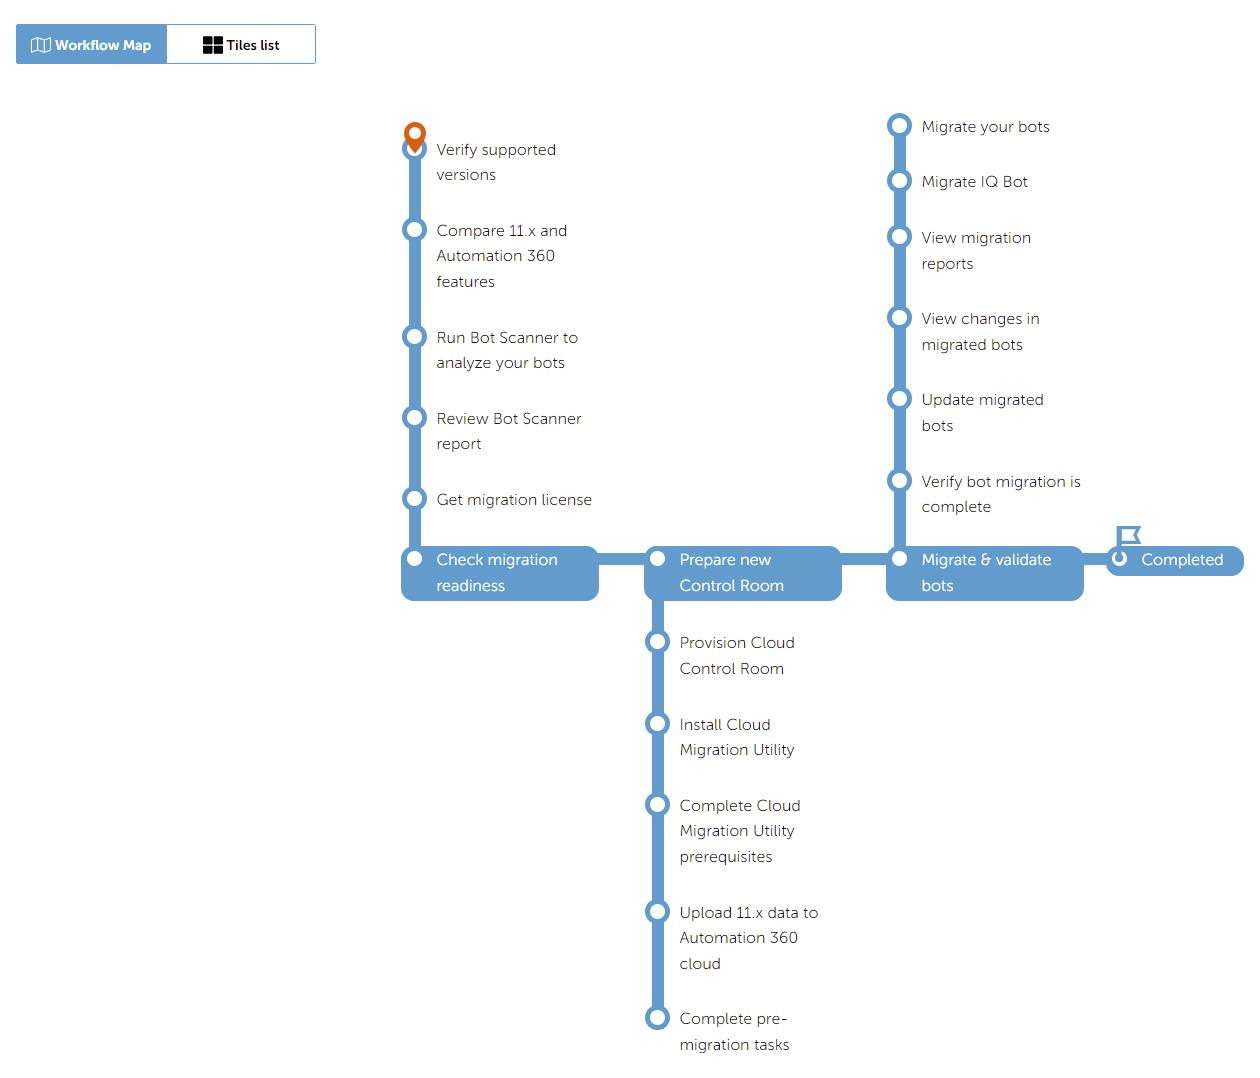 Expand analytics coverage to include more content types. For example, metro maps on our documentation portal are interactive and guided content experiences to help users navigate through complex process flows involving a series of tasks and sub-tasks. Getting consumption metrics and engagements insights on them will be useful to us.
What are some best practices to keep in mind?
- Start early: The sooner you adopt a data-driven strategy, the sooner you will see quantifiable outcomes.
- Encourage adoption: Start with a pilot project. Pick a strategic area, gather as many and different types of metrics as you can, track them over a quarter, gather insights and analyze trends, promote outcomes within and outside of the team, and expand adoption.
- Democratize ownership: Content creators should be as tuned into metrics and insights for their content areas as the SEO specialists and content leaders are. This cultivates a culture of ownership, user-centricity, and a strategic approach to content development.